Candlestick Patterns and Their Use in Different Timeframes
Understanding Candlestick Patterns for Daily, Weekly, Monthly, and Yearly Charts
Candlestick patterns are essential tools for traders and investors. They provide insights into market trends, sentiment, and potential reversals. These patterns work across different timeframes—daily, weekly, monthly, and yearly —each offering unique advantages depending on the trader’s strategy.
1️⃣ What Are Candlestick Patterns?
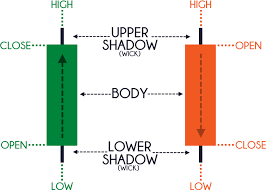
Candlestick charts are visual representations of price movements. Each candlestick consists of:
✅ Body – Represents the open and close prices.
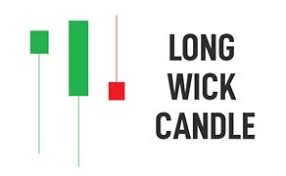
✅ Wick (Shadow) – Represents the highest and lowest prices.
✅ Color – Green (bullish) and Red (bearish).

Candlestick patterns help traders identify trend reversals, continuations, and market sentiment shifts.
2️⃣ Use of Candlestick Patterns in Different Timeframes
📅 Daily Candlestick Patterns (Short-Term Trading & Scalping)
– Suitable for intraday traders and swing traders.
– Helps in identifying quick reversals and price breakouts.
🔹 Common Patterns Used in Daily Charts:
✅ Doji – Indicates indecision in the market.
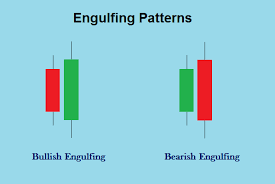
✅ Engulfing Pattern – A strong reversal signal.
✅ Hammer & Inverted Hammer – Bullish reversal signals.
📆 Weekly Candlestick Patterns (Medium-Term Trading)
– Used by position traders to understand broader market trends.
– Helps in filtering out intraday noise.
🔹 Common Patterns in Weekly Charts:
✅ Morning & Evening Star – Trend reversal signals.
✅ Bullish & Bearish Harami – Indicates potential reversals.
✅ Three White Soldiers & Three Black Crows – Strong bullish or bearish trend
📅 Monthly Candlestick Patterns (Long-Term Investing & Trend Analysis)
– Ideal for **long-term investors to spot macro trends.
– Helps in identifying key support & resistance levels.
🔹 Common Patterns in Monthly Charts:
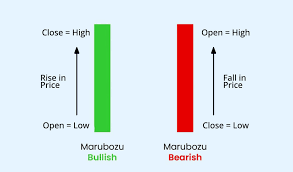
✅ Marubozu – Indicates strong bullish or bearish momentum.
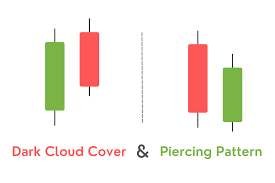
✅ Piercing Pattern & Dark Cloud Cover – Trend continuation or reversal signals.

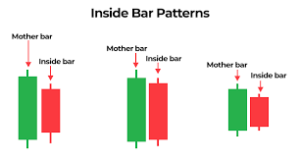
✅ Inside Bar – Signals market consolidation.


📅 Yearly Candlestick Patterns (Ultra-Long-Term Investment & Economic Cycles)
– Used by institutional investors & hedge funds to analyze economic trends.
– Helps in understanding business cycles & major market shifts.
🔹 Common Patterns in Yearly Charts:
✅ Long-Wicked Candles – High volatility in a year.
✅ Engulfing Pattern – Major trend reversal.

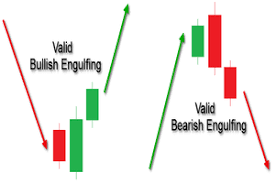
✅ Engulfing Pattern – Uncertainty in long-term markets.

3️⃣ How to Use Candlestick Patterns Effectively?
📊 Combine them with:
✅ Support & Resistance Levels for better accuracy.
✅ Indicators like RSI, MACD, and Moving Averages to confirm signals.
✅ Volume Analysis** to check the strength of patterns.
4️⃣ Conclusion
Candlestick patterns are powerful tools that work across all timeframes. Whether you are a day trader, swing trader, or long-term investor, mastering these patterns will help you make informed decisions.
🔔 Follow us for more stock market insights!
Would you like me to generate actual images for the candlestick patterns? 😊